The course of the workday
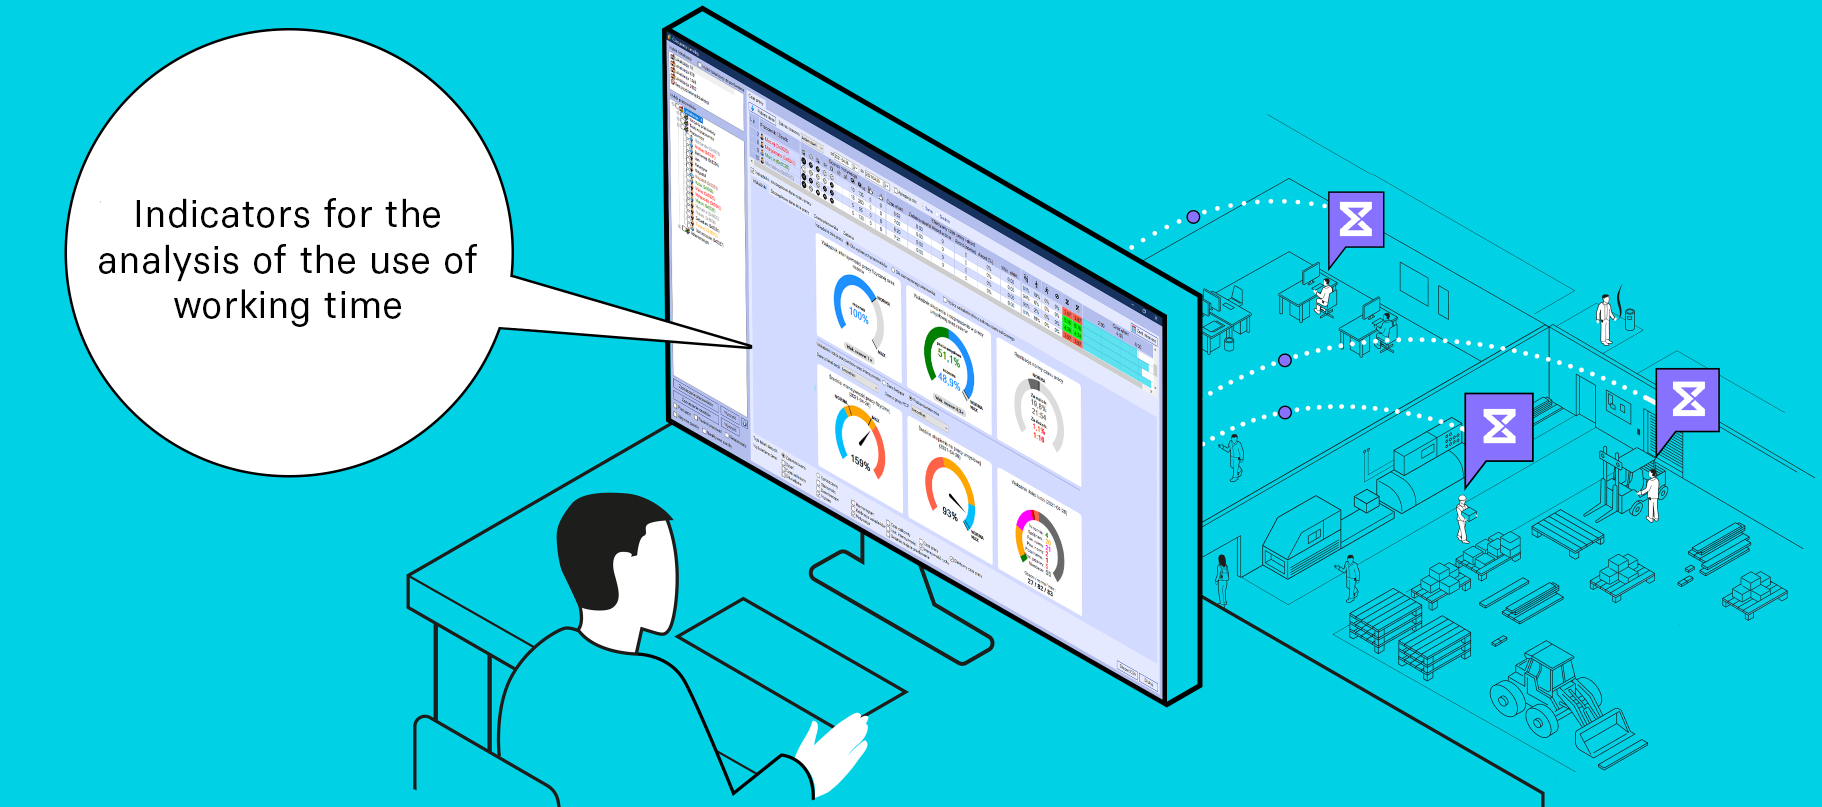
The TIMATE system records the course of the workday using TIMATE cards, including periods of activity in processes as well as periods of limited activity or waiting. Based on the activity level and information about the facility zone, it creates an indicative workday chart that supports the analysis of the course of business processes and work organization in specific areas.
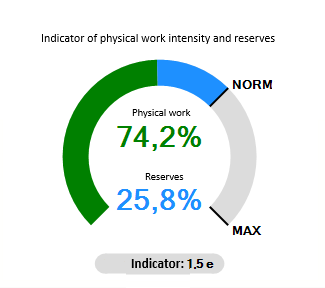
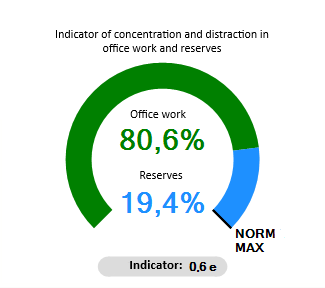
The higher the bar, the greater the intensity of physical activity. A low bar may indicate a waiting period, an organizational break, or another disruption in the process. Such a chart is supportive in nature and should always be interpreted in the context of the role, type of tasks, and working conditions.
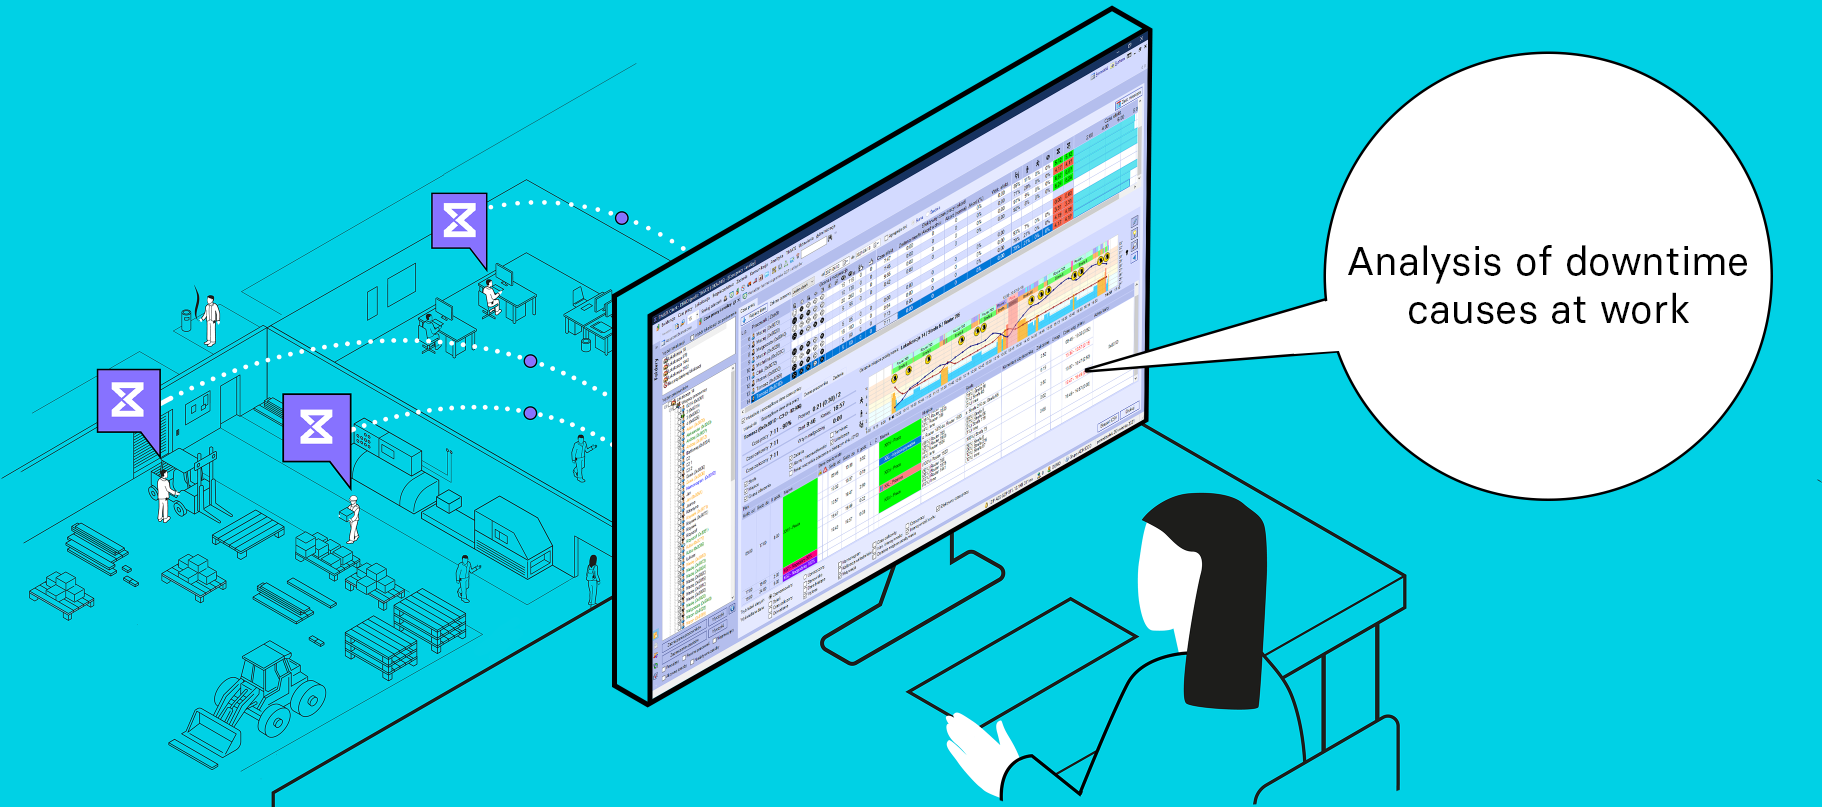
The person responsible for the process, who sees this chart and knows the role, scope of tasks, and workplace, can analyze what causes the disruptions and how they affect the course of the business process. Their causes may include waiting for goods, work organization, task preparation, scheduled meal breaks, or other operational conditions. In addition, supervisors receive descriptive information about the course of the workday and an indication of areas requiring attention. This allows them to analyze recurring deviations visible in the course of work that may affect process organization, such as delayed work start, extended task execution time, or the occurrence of overtime.